Healthy Skepticism International News
May 2010
Variables that predict belief in the appropriateness of drugs
This months issue was first presented as a poster at the Australian National Medicines Symposium August 2000 and is now being made available on the internet. It is an analysis by Peter R Mansfield of responses to an educational case study for general practitioners he wrote for the Australian National Prescribing Service in 1999. The case study and an introduction to some of the techniques used in misleading drug promotion is available in pdf format here. The feedback sent to participants written by Peter R Mansfield and Joel Lexchin in early 2000 is available here.
Year of graduation, level of “scepticism” and attendance at sponsored meetings are significant predictors of General Practitioners' beliefs about the appropriateness of drugs.
Dr Peter Mansfield Medical Lobby for Appropriate Marketing Inc. http://www.malam.asn.au [Because of the name change to Healthy Skepticism that URL is no longer available.]
Abstract
Aim: Analysis of the responses from 1,171 General Practitioners to Case study 5 “New Drugs” for variables that predict belief in the appropriateness of drugs. Strategies: Intervention: Case study 5 was part of National Prescribing Service newsletter 7 1999 and was an option towards Practice Incentive Program payments. Respondents were requested to rate appropriateness of therapies. Respondents were also questioned about their position on information from drug companies. Analysis: Quality Use of Medicines scores were constructed from the responses about the appropriateness of 10 drug group options. Depending on their answers to questions about information from drug companies respondents were classified as “Sceptical” or “Accepting”. Outcomes: There were no significant differences between the Quality Use of Medicines scores for General Practitioners with different medical school backgrounds. However, separate analysis of graduates from different medical schools revealed significant interactions with the other predictor variables. Important risk factors for unjustified beliefs about the appropriateness of drugs include in order of significance: • More recent graduation. • Stronger belief that “My prescribing is improved by information from drug companies.” • Belief that a lower % of drug advertisements contain potentially misleading claims. • More frequent attendance at drug company sponsored meetings. In a context where a new drug was not justified “Sceptical” GPs were significantly better at rating it as less appropriate than “Accepting” General Practitioners.
Introduction
Drug promotion is known to be a significant influence on doctors. However there is little information on whether or not it is more important than other influences. Berings et al (1994) studied 128 GPs in Flanders. They found that the number of visits from commercial representatives and the estimated utility of commercial information plus year of graduation accounted for 26% of the variation in the tendency to prescribe benzodiazepines. Caudill et al (1996) studied 446 Kentucky physicians practicing primary care adult medicine. They found that frequency of use of information provided by pharmaceutical representatives and the group practice setting remained significant independent positive predictors of high cost prescribing for 3 case studies in a multivariable regression model. The main purpose of the intervention was educate GPs and perhaps influence prescribing. However the collection of data provided the opportunity to replicate the findings of Berings and Caudill in an Australian setting. In addition this study used a larger sample size and more drug groups.
Methods
The Case Study Case study 5 was part of NPS newsletter 7 1999 and was distributed with the Australian Prescriber. It was promoted as an option towards Practice Incentive Program payments. The case was: You are visited by Mrs Parker an overweight 50 year old woman with mild hypertension and mildly elevated cholesterol levels but no other risk factors. Her only symptoms are insomnia and crying when she thinks her life is worthless now her children have left home. She is also anxious about her sons wedding in six months because she has always felt overwhelmed by big parties. Outcome variables GPs were asked to rate 10 drug and 5 non-drug therapies from 1 = Very inappropriate to 5 = Very appropriate. Only the responses to the drug options will be discussed here. Recommended responses were chosen in collaboration with NPS staff. The recommended diagnoses were: mild hypertension with mildly elevated cardiovascular risk (not high cardiovascular risk), life stage transition distress (not major depression) and normal introversion (not social phobia). The recommended response was to rate one drug group, the Thiazides, as: 5 = Very appropriate but to rate all the other drug groups as: 1 = Very inappropriate. A QUM score was constructed from the sum of the ratings for all 9 other drug options minus the rating for Thiazide. The best possible score was 4 = (9 x 1) - 5 and the worst possible score was 44 = (9 x 5)-1. Potential predictor variables There were 10 potential predictor variables: Five variables came from questions in the case study. GPs were asked the following: • How often do you see drug reps? ___/ month • How often do you attend drug company sponsored meetings? ___/ year • What percentage of drug advertisements contain potentially misleading claims? ___% GPs were asked to circle the answer most likely to be true for: • My prescribing is improved by information from drug companies: • Never Rarely Sometimes Often Always • I can sort the wheat (reliable drug promotion) from the chaff (potentially misleading claims): • Always Often Sometimes Rarely Never Practice size was estimated by counting the number of respondents at the same address. Data for 4 variables were obtained from the Medical Directory of Australia: gender, state where currently working, year of graduation and medical school where graduated. GPs who graduated overseas were grouped by country. A single category was created that included all countries that produced fewer than 10 GPs per country. The data was managed with Access 2000 and analysed with Stata 6.0 software.
Outcomes and Discussion
Demographics
Data is available from 1,171 GPs with complete data for 954. The demographics of the sample were similar to the GP population. See table 1. 74.5% of respondents were male and 25.5% female. Table 1 Distribution of respondents by state.
| State | Frequency | Percent of respondents n=1171 | Percent of GPs in Medical Directory database on 15 May 2000 n=21191 |
| NT | 1 | 0.09 | 0.8 |
| NSW | 346 | 29.55 | 35.6 |
| VIC | 351 | 29.97 | 24.3 |
| QLD | 262 | 22.37 | 17.3 |
| SA | 99 | 8.45 | 8.6 |
| WA | 59 | 5.04 | 9.0 |
| TAS | 34 | 2.90 | 2.6 |
| ACT | 19 | 1.62 | 1.8 |
| Total | 1171 | 100.00 | 100.0 |
The sample may be biased towards readers of the Australian Prescriber and/or GPs who were more strongly motivated by the financial incentives for doing case studies under the Practice Incentive Program. It may be biased against GPs who have less time to do case studies because they see many patients or have competition for their time eg young children. For the QUM score n = 1028, mean = 18.85 sd = 5.05 and range = 4 – 33.
Predictor Variables
Oneway ANOVA with Scheffé multiple comparisons and Kruskal-Wallis tests (including separate tests for each decade of graduation) found no significant differences between QUM scores for States nor for graduates of different medical schools. Pairwise Pearson correlation with and without Šidák correction for multiple comparisons and Spearman’s rho were used to assess relationships between the other potential predictor variables and the QUM score. The predictors with significant correlations is order of significance were years since graduation, belief that own prescribing is improved by drug company information, estimate of the % of drug advertisements that are misleading and practice size. See table 2. Table 2 Potential predictor variables for QUM score
| Pearson r | p | Šidák corrected p | |
| Years since graduation | -0.2140 | 0.0000 | 0.0000 |
| Belief prescribing improved by drug co info. | 0.1513 | 0.0000 | 0.0000 |
| Estimate of % of ads misleading | -0.1240 | 0.0001 | 0.0042 |
| Practice size | 0.1036 | 0.0009 | 0.0313 |
| Male or Female | 0.0835 | 0.0074 | 0.2335 |
| Frequency of sponsored meetings | 0.0635 | 0.0426 | 0.7913 |
| Frequency of drug rep visits | 0.0363 | 0.2474 | 1.0000 |
| Can sort wheat from chaff | 0.0362 | 0.2501 | 1.0000 |
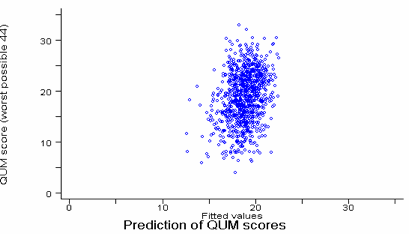
Ordinary Least Squares (OLS) Multiple Linear Regression produced a model, illustrated in graph 1, where 4 variables accounted for 8% of the variation in QUM scores (R2 8.4% adjusted R2 8.0%). In order of significance the variables predicting better QUM scores were: Less recent graduation p<0.001, Lower estimate of own prescribing being improved by drug company information p<0.001, Higher estimate of % of ads misleading p=0.005 and lower frequency of sponsored meetings p=0.005.
The fact that the model accounted for only 8% of the variability suggests the following possibilities:
• There may be many other influences involved. If so, the challenge is to measure them.
• Some of the variables may not have been measured accurately enough. For example rapid answers may not have reflected the doctors' real beliefs if the doctors' only reason for doing the case was pressure to contribute to incentive payments for his or her practice. Answers may have been distorted in response to articles about drug promotion in the NPS News.
• There may be interactions between variables that need to be taken into account. The section below presents evidence that there were significant interactions between medical school and the other variables.
• Allowing doctors to have a neutral choice when rating drugs may have been an error given that the decision to use a drug or not is binary.
• A less ambiguous case may have reduced variability in the ratings for drug groups that may have arisen from different interpretations of the case.
• Some variables may have a bigger impact on prescribing behaviour than on beliefs.
The other variables did not make a significant contribution. Given that drug representatives are known to be a major influence on prescribing it is interesting that frequency of visits did not make a significant contribution to the regression model. This study may have under estimated the importance of frequency of drug representatives visits and attendance at sponsored meetings if the GPs estimates were less accurate than the other information provided. Another possibility is that much of the influence of representatives is subconscious and thus affects behaviour without affecting knowledge. Finally there were strong correlations between frequency of representative visits and beliefs about drug company information. Perhaps scepticism is more important than avoidance.
Reanalysis of the data after Boxcox transformations to account for the non-normal distributions of the variables did not change the results. One weakness of OLS regression is that models are sometimes distorted by small numbers of cases with unusual combinations of values. Robust regression and Quartile regression with and without bootstrapping were used to check for alternative models but produced almost identical models.
Graph 1 Relationship between QUM scores and the scores predicted by the 8% OLS regression model.

Medical schools interact with the other variables
The effects of recent influences may vary depending on early influences. Thus it was important to test whether there were interactions between medical school background and the other variables that would account for more of the unexplained variability. Consequently, OLS regressions were done for graduates of each medical school and each foreign country separately. The results for regressions that produced significant models are summarised in table 3. Table 3 Regression models by medical school.
| “Medical School” | n | R squared | Adjusted R squared | Predictor variables for better QUM scores in order of significance |
| 2 | 149 | 21.3% | 19.7% | Less recent graduation Higher estimate of % of ads misleading Lower estimate of Rx being improved by drug co. info. |
| 6 | 178 | 8.7% | 7.7% | Lower estimate of Rx being improved by drug co. info. Less recent graduation |
| 7 | 103 | 15.8% | 12.3% | Less recent graduation Smaller estimated practice size Less estimated drug reps visits Lower estimate of Rx being improved by drug co. info. |
| 11 | 39 | 47% | 31% | Higher estimate of % of ads misleading Less recent graduation More confidence in ability to sort wheat from chaff. |
| All others combined | 697 | 5.7 | 5.4 | Less recent graduation Lower estimate of Rx being improved by drug co. info. |
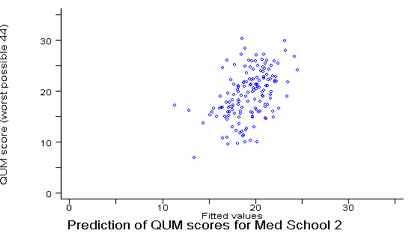
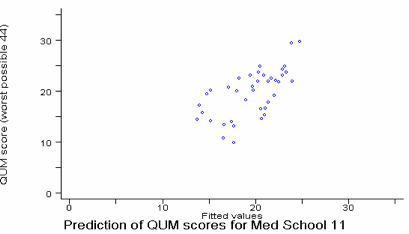
The OLS regression models for medical schools 2, and 11 are illustrated in graphs 2 and 3. For medical school 11 the variability from the predicted score is less with higher predicted scores. Medical school 16 (n=116) was a stark contrast to the other large schools. None of the potential predictor variables even correlated with QUM scores, let alone survived OLS regression.
Graph 2 Relationship between QUM scores for graduates of medical school 2 and the scores predicted by a 19.7% OLS regression model.
 Graph 3 Relationship between QUM scores for graduates of medical school 11 and the scores predicted by a 31% OLS regression model.
 Being “Accepting” is a significant risk factor and being “Sceptical” is a protective factor
The two variables “Higher estimate of % of ads misleading” and “Lower estimate of prescribing being improved by drug co. info.” were combined to separate GPs into three groups. The term “Accepting” is used for GPs who believe that less than 50% of drug advertisements contain potentially misleading claims and also believe that their prescribing is often or always improved by information from drug companies. Ten percent (108 of 1078) of the GPs indicated they were “Accepting”. The term “Sceptical” is used for 9.5% (n=102) of GPs who believe that more than 50% of drug advertisements contain potentially misleading claims and also believe that their prescribing is rarely or never improved by information from drug companies. Ten percent (102) of the GPs indicated they were “Sceptical”. The term “Majority” is used for the 80.5% (n=868) of GPs between the two extremes. The table below shows that being “Accepting” is a significant risk factor for being more positive than all other respondents (“Sceptical” plus “Majority”) about 5 of the 10 drug options listed. For all of the other 5 drug options there were trends in the expected direction that did not reach statistical significance with a 2-sided Fisher’s exact test.
Table 4 Ratings for unjustified drug groups comparing “Accepting” GPs with all others.
| Drug group | % of “Non-Accepting” majority rating 3, 4, or 5 = Very appropriate n≈970 | % of “Accepting” rating 3, 4, or 5 = Very appropriate n = 108 | Risk ratio with 95% CI | 2-sided Fisher's exact P |
| Appetite Suppressants | 2.5% | 6.5%. | 2.765217 (1.215823 - 6.289096) | 0.0230 |
| Calcium Channel blocker | 53% | 68.5% | 1.295574 (1.125234 - 1.491701) | 0.0022 |
| AT2 antagonist | 43% | 62% | 1.433208 (1.2123 - 1.694371) | 0.0004 |
| Benzodiazepine | 9% | 16% | 1.758361 (1.088569 - 2.840275) | 0.0366 |
| SSRI for social phobia | 35% | 45% | 1.283923 (1.023848 - 1.610061) | 0.0437 |
There were no significant differences overall between the percentages of graduates of different medical schools who were “Accepting” vs “Sceptical”. (Pearson Chi2 p=0.176)
The newest drug group AT2 antagonists
The new AT2 antagonists were being heavily promoted at the time the case study was available. As yet there is no evidence of clinically important long-term benefit from these drugs.
Four variables accounted for 6% of the variation in AT2 antagonist ratings. In order of influence there were: Years since graduation, Estimate of % of ads misleading, Belief prescribing improved by drug company information and Practice size. The other variables did not make a significant contribution. AT2 antagonist ratings tended to be better (closer to 1 = Very inappropriate) if GPs had graduated longer ago, believed that most drug advertisements were potentially misleading, believed that their prescribing was rarely or never improved by information from drug companies and worked in smaller practices.
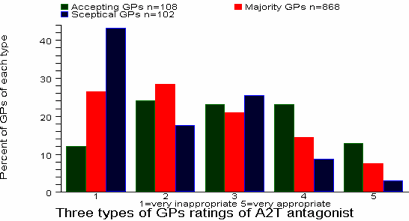
Graph 6 shows how AT2 antagonist ratings differed between “Accepting”, “Majority” and “Sceptical” GPs. The difference was highly significant. (Pearson Chi2 p<0.001)
Graph 6 GP ratings for AT2 antagonist

Conclusions
Important risk factors for unjustified beliefs about the appropriateness of drugs include in order of significance: • More recent graduation. • Stronger belief that “My prescribing is improved by information from drug companies.” • Belief that a lower % of drug advertisements contain potentially misleading claims. • More frequent attendance at drug company sponsored meetings. The impact of those predictor variables varied depending on the medical school that GPs graduated from. Key research and policy questions arising include: • What are the implications for medical education of the finding that the impact of the main predictor variables varies depending on medical school? Why did graduation from only some medical schools add to the ability of the model to predict the QUM scores? • Why did more recently graduated GPs have worse QUM scores on average? Can anything be done about that? • What are the best ways to measure “Acceptance” / “Scepticism”? • Are these factors the cause of variability or just a marker for the real cause? • Does “Acceptance” / “Scepticism” cause or predict variability in behaviour (prescribing and/or other components of medical care)? • Can “Scepticism” be taught to medical students? Can “Scepticism” be taught to GPs? If so, will teaching “Scepticism” lead to improved prescribing and/or medical care? • Should the involvement of GPs, Divisions of General Practice and the RACGP and in drug company sponsored meetings be reviewed? • Would there be similar findings for other doctors and for pharmacists, nurses, government officials, drug company staff and the general public?
Acknowledgments
I thank Lynn Telfer for data entry, Catherine Oliver for quality control, Melissa Raven and Joel Lexchin for commenting on drafts of this poster, Flinders University Medical Illustration and Media for presentation, the NPS for support and funding, Robyn, Clare, Alice and Hannah Mansfield for understanding and all the GPs who did the case study for their participation.
1. Avorn J, Chen M, Hartley R. Scientific versus commercial sources of influence on the prescribing behavior of physicians. American Journal of Medicine 1982;73:4-8.
2. Bowman JA, Pearle DL. Changes in drug prescribing patterns related to commercial company funding of continuing medical education. J Continuing Education 1988;8:13-20.
3. Product growth: how can it be achieved in an era of tighter resources? The ARF/ABP pharmaceutical study. American Business Press and Advertising Research Foundation. 10. 1993. New York, American Business Press.
4. Orlowski JP, Wateska L. The effects of pharmaceutical firm enticements on physician prescribing patterns: there’s no such thing as a free lunch. Chest 1992;102:270-3.
5. Chren M-M,.Landefeld CS. Physicians’ behavior and their interactions with drug companies: a controlled study of physicians who requested additions to a hospital drug formulary. JAMA 1994;271:684-9.
6. Williams AP, Cockerill R, Lowy FH. The physician as prescriber: relations between knowledge about prescription drugs, encounters with patients and the pharmaceutical industry and prescription volume. Health and Canadian Society 1995;3:135-66.
7. Berings D, Blondeel L, Habraken H. The effect of industry-independent drug information on the prescribing of benzodiazepines in general practice. Eur J Clin Pharmacol 1994;46:501-505.
8. Caudill TS, Johnson MS, Rich EC, McKinney WP. Physicians, pharmaceutical sales representatives, and the cost of prescribing. Arch Fam Med 1996;5:201-6.
9. Kardes FR, Kalyanaram G. Order-of-entry effects on consumer memory and judgment: An information integration perspective. J Market Research 1992;29:3:343-357
Page views since 15 March 2010: 9395
Comments
Our members can see and make comments on this page.


